If you have questions of need assistance navigating the Tableau dashboards email: support@mainedrugdata.org
Overview
Syringe service programs/Syringe access programs (SSPs or SAPs) are community-based prevention and harm reduction programs that provide a range of services. These include linking individuals to substance-use disorder treatment, recovery services, infectious disease testing, housing, food, and medical services. They also provide naloxone—a medication that can reverse an opioid related drug overdose—access to sterile syringes and injection equipment, and fentanyl test strips. Syringe service programs serve an essential role in the health of the community through the safe disposal of injection equipment and preventing the outbreak of blood borne diseases such as Hepatitis C and HIV.
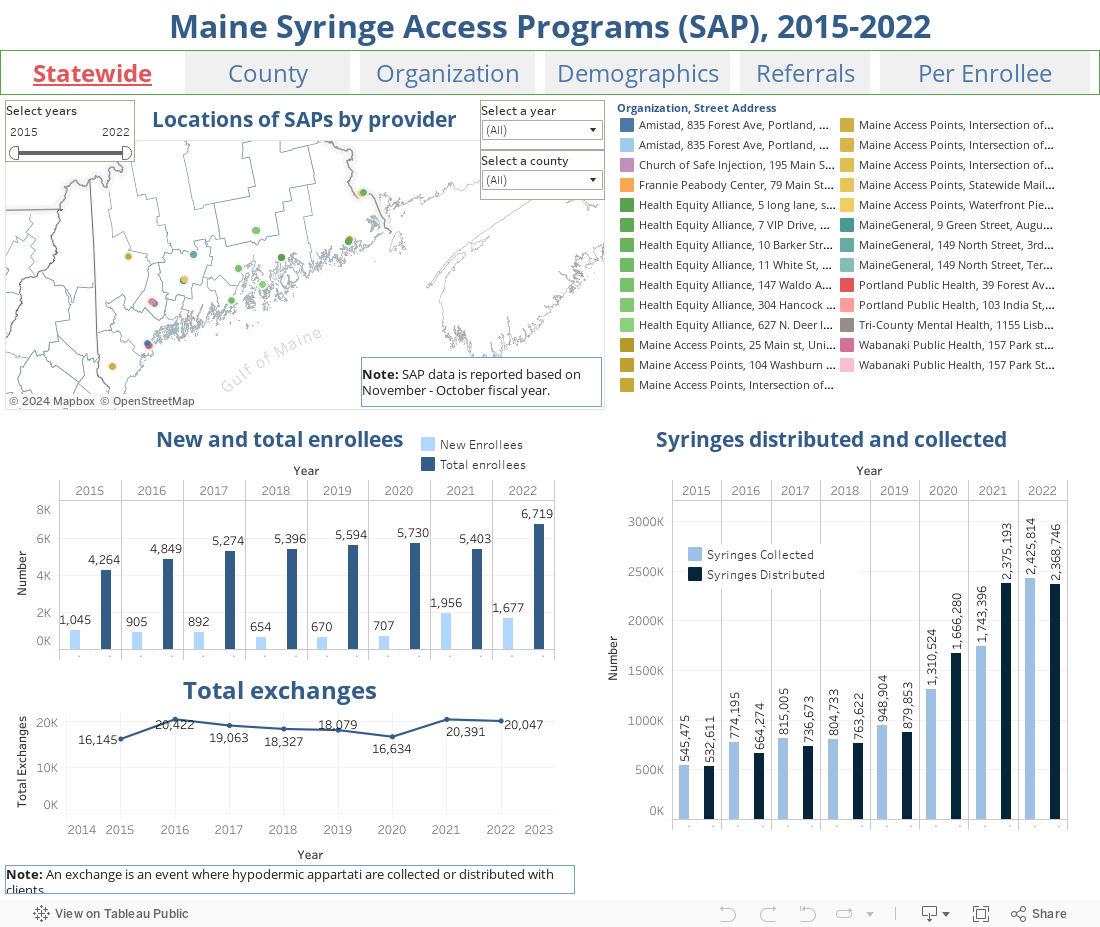
The following visualization contains data compiled from the Syringe Service Programs Annual Report submitted annually to the legislature by Maine CDC. There are 6 tabs in this dashboard to allow users quick navigation among metrics.
- Statewide – Locations of syringe access programs by year and temporal trends of enrollees, exchange events, and syringes distributed and collected.
- County – Map of enrollees by county with temporal trends of enrollees, exchange events, and syringes distributed and collected.
- Organization – Locations of syringe access programs with temporal trends of enrollees, exchange events, and syringes distributed and collected.
- Demographics – Enrollee gender, age, race, and ethnicity.
- Referrals – Temporal trends in referrals to housing, primary care, clinics, HIV testing, Hepatitis C testing, and substance use disorder treatment providers.
- Per Enrollee – Map of syringes distributed per enrollee by county with calculated metrics on the number of syringes, exchanges, and referrals per enrollee.
Navigation Instructions
The data in this dashboard are fully interactive. Users can select specific counties or combinations of counties, specific years, ranges of years, and syringe service provider for most metrics. Maps, graphs, and data tables can be downloaded by using the download button at the bottom of the visualization. Remember, you can always reload the page to restore the default view of the visualization or press the reset button at the bottom of the visualization.
Please note the following:
- The Syringe Service Program year runs from November 1 to October 31.
- Due to the COVID-19 pandemic, and several public health practices such as social distancing, the collection and tracking of data during 2020 and 2021 was limited.
- Due to the COVID-19 pandemic, referrals for syringe service program enrollees to community-based services was limited.
Source: Tableau dashboard created by Dr. Fuyu Xu Ph.D. a Research Associate at the Margaret Chase Smith Policy Center at the University of Maine with data and collaboration from the Rural Drug and Alcohol Research Program at the Center. Syringe service program data compiled by Maine CDC annual reports to the legislature 2015-2020. Please note that the Syringe Service Program year runs from November 1 to October 31. The collection and recording of syringe service provider data was impacted by the public health measures enacted to combat the covid-19 pandemic. Syringe service providers were also limited in their face-to-face contact with clients limiting their ability to refer individuals to treatment and services. Syringe service provider enrollees are not deduplicated. Individuals can be a client of multiple providers throughout the state.