If you have questions of need assistance navigating the Tableau dashboards email: support@mainedrugdata.org
Overview
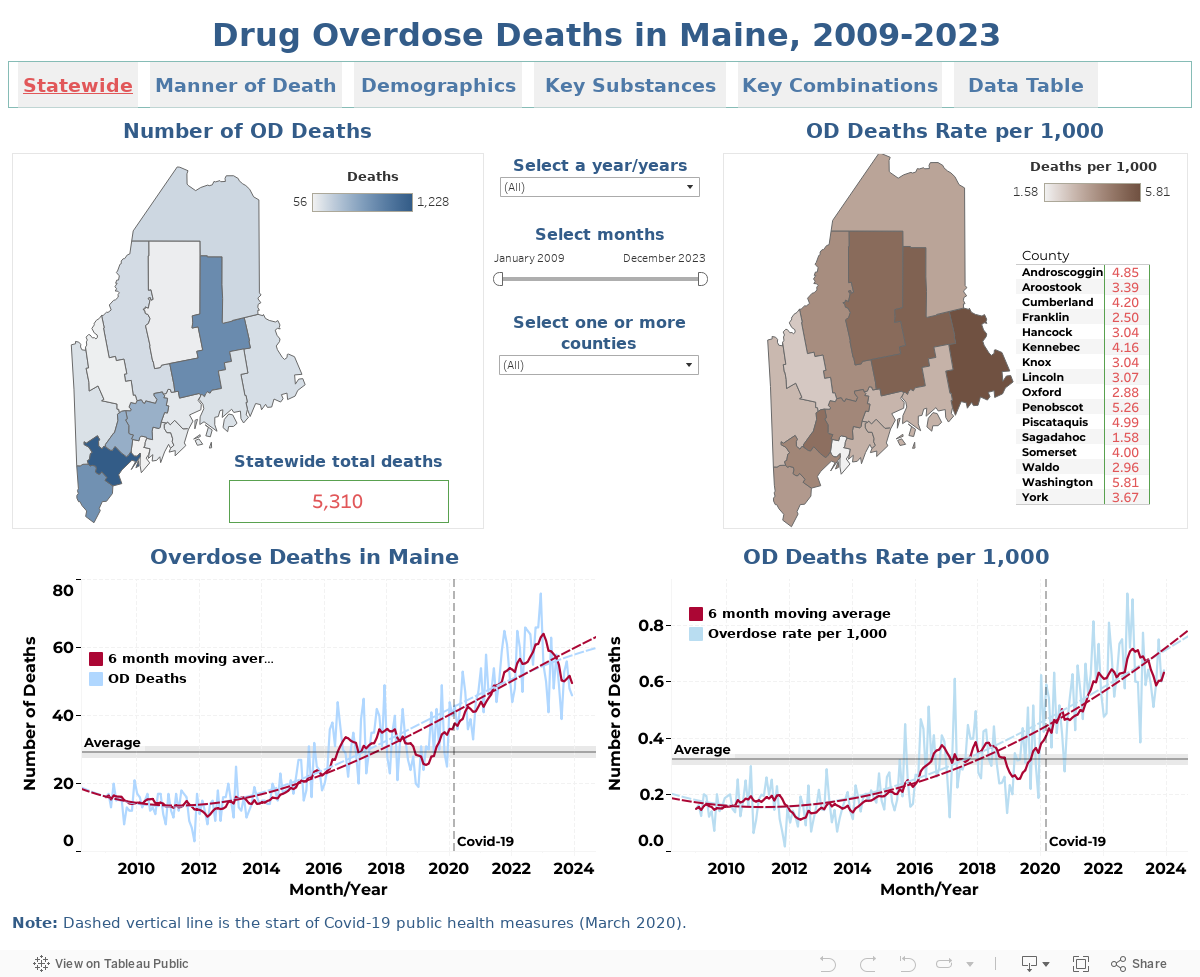
The following visualization contains fatal overdose data from 2009 through the most recent quarter drug death report released by the Office of the Maine Attorney General. There are 6 tabs in this dashboard to allow users quick navigation among metrics.
- Statewide: Number of deaths and deaths per capita maps with temporal trends that include 6-month moving averages.
- Manner of Death: Number and percentage of accidents, suicides, and other/undetermined deaths.
- Demographics: Temporal trends and percentages by biological sex and age group.
- Key substances: Number of fatal overdoses involving key substances.
- Key combinations: Number of fatal overdoses involving fentanyl and other cointoxicants.
- Data table: A concise table containing county population, percentage of population, fatal overdose incidents, percent of total fatal overdoses, and per capita rate of fatal overdoses.
Navigation Instructions
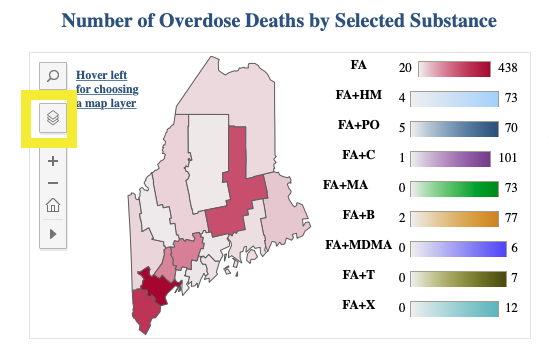
The data in this dashboard are fully interactive. Users can select specific counties or combinations of counties, specific years, ranges of years, quarters, and months. In the key substances and key combinations tabs, users can hover over the map to select layers for individual substances (see the following image). Maps, graphs, and data tables can be downloaded by using the download button at the bottom of the visualization. Remember, you can always reload the page to restore the default view of the visualization or press the reset button at the bottom of the visualization.
Highlighted on the left hand side of the image below is the layer selection button on the Key Substances and Key Combination Maps. To select a new layer, select the desired substance of combination and deselect the prior substance or combination. FA = Fentanyl or Fentanyl Analogs, HM = Heroin/Morphine, PO = Pharmaceutical Opioid Group, C = Cocaine, MA = Methamphetamine/Amphetamine, B = Benzodiazepines, T = Nonpharmaceutical Tramadol, and X = Xylazine.
To protect privacy, all data points under 5 are suppressed and listed as <5.
Dashboard last updated: 12/31/2024
Source: Tableau dashboard created by Dr. Fuyu Xu Ph.D. a Research Associate at the Margaret Chase Smith Policy Center at the University of Maine with data and collaboration from the Rural Drug and Alcohol Research Program at the Center.