If you have questions of need assistance navigating the Tableau dashboards email: support@mainedrugdata.org
Overview
The following visualization contains programatic data from the Overdose Prevention Through Intensive Outreach, Naloxone, and Safety Initiative (OPTIONS) through the most recent month of data released by the Office of Behavioral Health. The OPTIONS Initiative is a coordinated effort to improve the health of all Mainers with substance use disorder as well as their affected others. OPTIONS supports treatment, harm reduction and recovery as well as aiming to reduce the number of fatal and nonfatal drug overdoses in Maine.
There are 5 tabs in this dashboard to allow users quick navigation among metrics.
- Referrals to Liaisons: This includes co-response calls with law enforcement, self referrals, referrals made by affected others, and proactive referrals from public safety, public health and clinical agencies to OPTIONS behavioral health Liaisons.
- Client Interactions: These include referrals from OPTIONS Liaisons on behalf of clients to various harm reduction, treatment, and recovery pathways.
- Demographics: This tab contains two subtabs for Descriptive (race, ethnicity, and gender) demographics as well as Programatic (housing, carceral status, client type) demographics
- Overdose Education and Naloxone Distribution: Included are trainings, number of people trained, and number of naloxone kits distributed.
- Know Your OPTIONS: This includes an embedded website from the OPTIONS initiative webpage that includes contact information for the Liaisons in each of Maine’s 16 counties.
Navigation Instructions
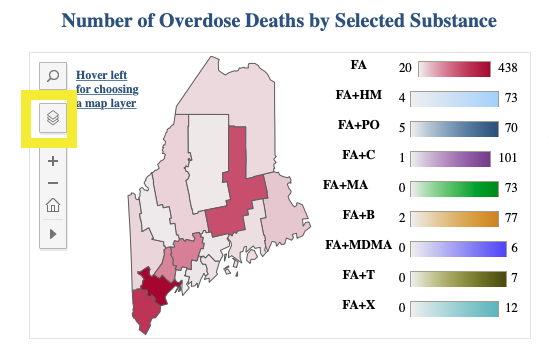
The data in this dashboard are fully interactive. Users can select specific counties or combinations of counties, as well as specific months. In tabs containing maps, users can hover over the map to select layers to filter by individual referral, demographic, or client interaction types (see the following image). Maps, graphs, and data tables can be downloaded by using the download button at the bottom of the visualization. Remember, you can always reload the page to restore the default view of the visualization or press the reset button at the bottom of the visualization.
Highlighted on the left hand side of the image below is the layer selection button for maps that include this feature To select a new layer, select the desired metric(s) and deselect the prior metric(s).

To protect privacy, all data points under 5 are suppressed and listed as <5.
Source: Tableau dashboard created by Dr. Fuyu Xu Ph.D. a Research Associate at the Margaret Chase Smith Policy Center at the University of Maine with data and collaboration from the Rural Drug and Alcohol Research Program at the Center.